


Interactive tables with sort and filter capabilities can be a good way to explore your data. They’re also handy when you want to share a data set, so other people can do some exploring. The R package DT (for data tables) makes creating such tables easy.
Creating data tables
Here’s how.
First, I loaded two packages: DT and rio for importing data.
library(DT)
library(rio)
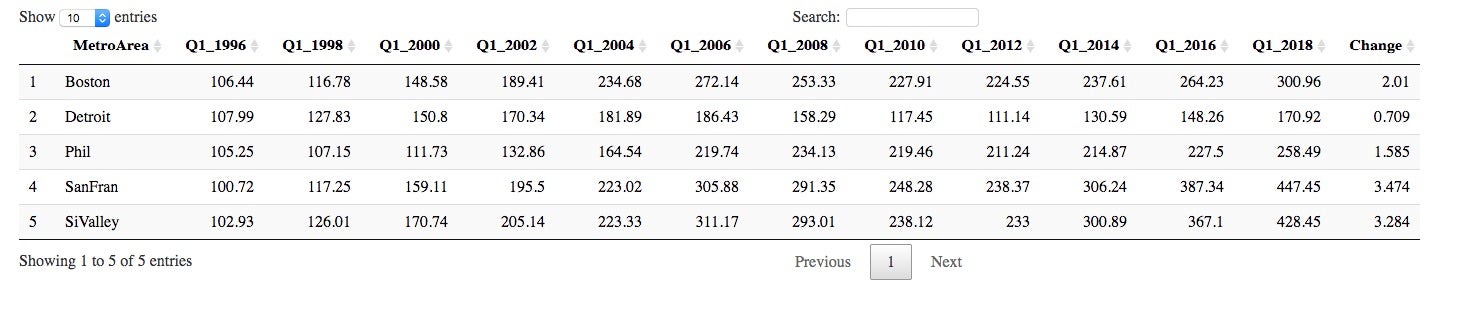
Next, I imported data about housing prices in five US metro areas. This data is based on an index where every city’s home price starts at 100 in January 1995, and then you can see the changes over time. There’s code at the bottom of this article if you want to use the same data to create a data frame named prices and follow along.
The data includes one price point for every two years—first quarter of 1996, Q1 1998, and so on through the first quarter of 2018. There’s also a final column showing the change from that 100 starting index through Q1 2018. If you were to multiply that column by 100, it would be the percent change.
To make that into an interactive HTML table, I’d use DT’s datatable() function. It’s as easy as datatable(prices) and voilà!: a table that should look something like:
 Sharon Machlis/IDG
A table created with the R DT package
You can sort by any column: One click sorts ascending, and a second click sorts descending. The search box lets you filter rows.
Options for datatables
There are a lot of other options for datatables.
Adding filters
You can add filters for each column with the filter argument (note: the search box looks for text across all columns)
datatable(prices, filter = 'top')
Hiding row numbers
If you don’t want the row numbers showing up, use the rownames = FALSE argument:
datatable(prices, filter = 'top', rownames = FALSE)
The row numbers should be gone.
You can get rid of the paging menu as well, which seems like a good idea because all the rows are already displaying. For this task, you need datatable’s options argument, which takes a list as its value. See the format:
datatable(prices, filter = 'top', options = list(paging = FALSE))If you run the code, the paging menu should be gone.
Finding options
How do you know what options are available? And which ones are their own arguments to datatable, like filter and rownames, and which ones have to be in the options = list() argument? That confused me for a while—until I finally broke down and read the help file for the datatable function.
All the arguments that don’t need to be inside options = list() should be listed in the help file, which you can see by running ?datatable. For information about what you can put inside the options list, however, the help file sends you somewhere else: to documentation for the datatables JavaScript library. That’s because DT is an R wrapper for the datatables JavaScript library. Click the https://datatables.net/reference/option/ link to see the available options.
Formatting columns
Formatting the columns is another type of useful customization—for example, formatting the Change column so it displays as percents. DT has several column format functions, including formatPercentage() and formatCurrency(). These are separate functions, not an option or argument inside datatable, and they take a data table as their first argument.
In the following code, I pipe the results from the initial datatable() into the formatPercentage() function. Then I tell formatPercentage() first the name of my column to be formatted and then how many digits I want to round to after the decimal place.
datatable(prices, filter = 'top', options = list(paging = FALSE)) %>%
  formatPercentage('Change', digits = 1)
Run that code to see the Change column display as percents.
If you type DT::format in RStudio and pause, you’ll see a dropdown list of other available DT format functions.
Saving as an HTML table
Do you want to save this table as an HTML file? You can with the HTML Widgets package.
The code below loads the htmlwidgets library, saves the table to a variable called mytable, and then uses the saveWidget function to save it to an HTML file called mytable.html.
library(htmlwidgets)
mytable <- datatable(prices, filter = 'top', options = list(paging = FALSE)) %>%
  formatPercentage('Change', digits = 1)
saveWidget(mytable, "mytable.html")
mytable.html is a conventional HTML file that can be opened in any browser and used on the web.
Pretty cool.
Code for the home prices data frame
prices <- data.frame(stringsAsFactors=FALSE,
MetroArea = c("Boston", "Detroit", "Phil", "SanFran", "SiValley"),
Q1_1996 = c(106.44, 107.99, 105.25, 100.72, 102.93),
Q1_1998 = c(116.78, 127.83, 107.15, 117.25, 126.01),
Q1_2000 = c(148.58, 150.8, 111.73, 159.11, 170.74),
Q1_2002 = c(189.41, 170.34, 132.86, 195.5, 205.14),
Q1_2004 = c(234.68, 181.89, 164.54, 223.02, 223.33),
Q1_2006 = c(272.14, 186.43, 219.74, 305.88, 311.17),
Q1_2008 = c(253.33, 158.29, 234.13, 291.35, 293.01),
Q1_2010 = c(227.91, 117.45, 219.46, 248.28, 238.12),
Q1_2012 = c(224.55, 111.14, 211.24, 238.37, 233),
Q1_2014 = c(237.61, 130.59, 214.87, 306.24, 300.89),
Q1_2016 = c(264.23, 148.26, 227.5, 387.34, 367.1),
Q1_2018 = c(300.96, 170.92, 258.49, 447.45, 428.45),
Change = c(2.01, 0.709, 1.585, 3.474, 3.284)
)